Create a starting population
Those are just a set of different haplotypes though.
Let's now generate a set of N individuals forming a population. We'll assume they are haploid here so each will carry has one of the starting haplotypes. To keep track of the evolution over G generations, let's also record these haplotypes in the first row of a matrix.
You can choose your favourite population size but I'm going to pick to keep things simple (don't go too huge at the moment!)
N = 100 # number of individuals
G = 100 # number of generations
population = matrix(
  NA, nrow = G, ncol = N,
  dimnames = list(
    sprintf( "generation=%d", 1:G ),
    sprintf( "individual=%d", 1:N )
  )
)
N = 100  # number of individuals
G = 100  # number of generations

population = np.empty((G, N), dtype=int)
To generate our starting population let's randomly sample our generated haplotypes for the first generation.
Notice that in R the first row has index 1, whereas in Python it is 0 - that's one of the most difficult
things to get used to when using both languages.
population[1,] = sample( 1:H, size = N, replace = TRUE )
population[0] = np.random.choice(H, size=N, replace=True)
Now we can plot what our population looks like:
plot.haplotypes( haplotypes[population[1,],] )
ax = plot_haplotypes(haplotypes[population[0]])
Which should show something like this:
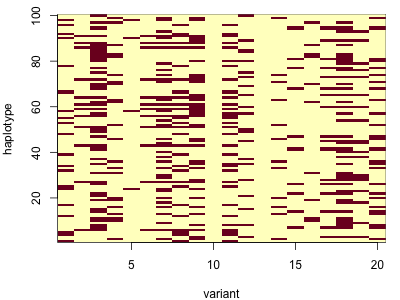
So this looks a lot like our plot of starting haplotypes, except each of our samples (rows) has picked one of the starting haplotypes at random.