Density, cumulative probability, and quantiles
The distribution functions in come in groups that differ by their first character - 'd', 'p', 'q', and 'r'.
d<name>()the probability or probability density functionp<name>()the cumulative density function, that you get by adding up values of the density.q<name>()the quantile function, that is the inverse of the cumulative density.r<name>()that sample random values from the distribution.
This page describes the first three of these. For example, here is a picture of a normally distributed variable :
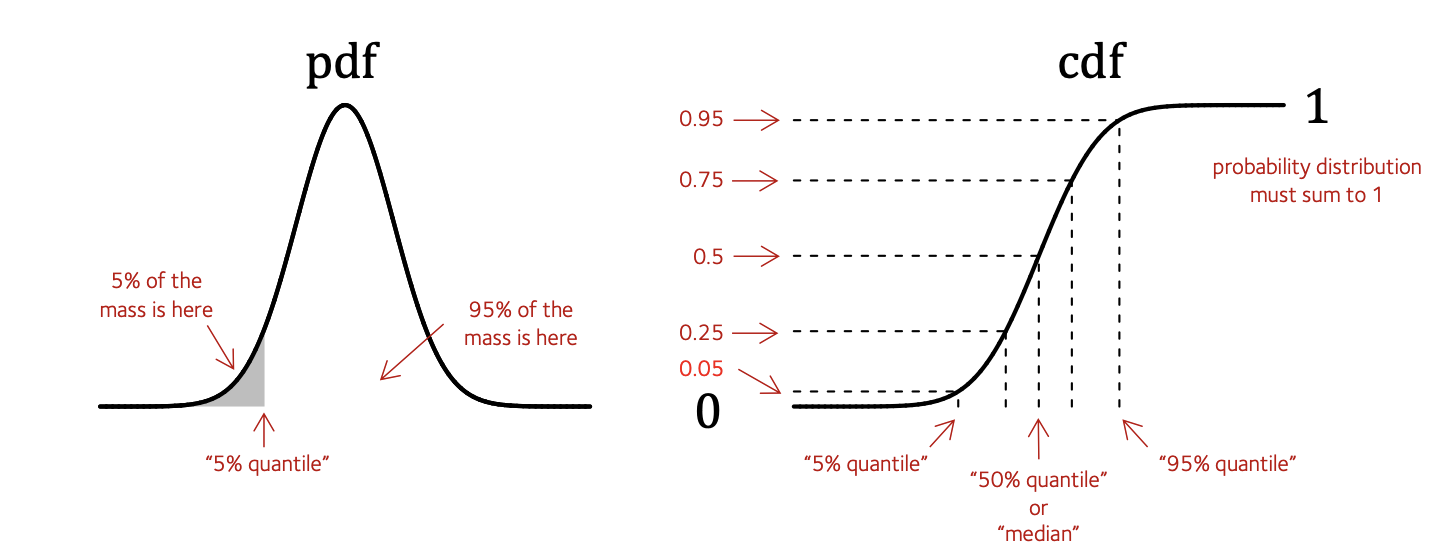
I've annotated this with various pieces of information.
On the left is shown the probability density function or pdf which you plotted already. You could compute this using dnorm() in R as we did on this page.
To fix terminology I've labelled a particular point on the X axis - the quantile. That means: the value such that exactly 5% of the mass of the distribution is .
On the right is shown the cumulative density function or cdf. You can compute using pnorm() in R.
The cdf is just worked out by summing up (that is, integrating) the area under the pdf from left to right.
Since this is a distribution, the total area under the distribution is . That means the cdf must asymptote to on the right - look, it does!
Quantile levels
As the red annotations indicate, the cdf is the function that maps values of and tells you which quantile they correspond to - i.e. how much mass is to the left of them. For example:
For a normal distribution with mean 10 and standard deviation 3, how much of the probability mass is ?
Hint use pnorm()!
Finding quantiles
You might also want to go the other way: that is, finds the value of that corresponding to a given quantile - e.g. the value of that has at least 5%, or 25% mass to the left of it.
This is the job of the quantile function. The quantile function is just the inverse of the cdf (it maps the y axis values back to the x axis).
Use qnorm() to answer: For a standard normal distribution (with mean 0 and standard deviation 1), what's the 2.5% quantile at?
Hint. Again, the help page might help. qnorm() uses the name p for the choice of quantile, eg. p=0.025 in the above.
How does the 2.5% quantile change as you change the standard deviation?